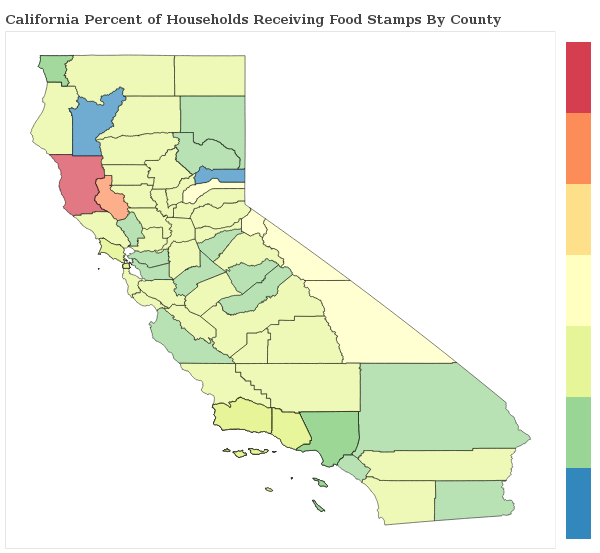
1.5% of Households Receive Food Stamps in Santa Maria, California
Food Stamps in Santa Maria, California
What percent of Households Receive Food Stamps in Santa Maria?
The percentage of households receiving food stamps in the last year in Santa Maria is 1.5%.
How Many Households in Santa Maria Receive Food Stamps?
There are 424 households out of 27771 in Santa Maria receiving food stamps.
Where does Santa Maria Rank in Comparison to Other California Cities for HouseHolds Receiving Food Stamps?
Santa Maria ranks 610th out of 1018 cities and towns in California for the least number of households receiving food stamps. A smaller numeric rank indicates a lower percentage of homes receive food stamps.
How do other cities in Santa Barbara County compare to Santa Maria when it comes to the percentage of homes receiving Food Stamps?
Cities must have a minimum of 1,000 residents to qualify
| City | Food Stamps | Details |
|---|---|---|
Carpinteria |
2.0% |
102 of 5,136 Carpinteria households received food stamps within the past year. |
Goleta |
0.8% |
82 of 10,896 Goleta households received food stamps within the past year. |
Buellton |
1.9% |
37 of 1,956 Buellton households received food stamps within the past year. |
Guadalupe |
1.4% |
28 of 1,944 Guadalupe households received food stamps within the past year. |
Isla Vista |
2.5% |
130 of 5,134 Isla Vista households received food stamps within the past year. |
Lompoc |
1.2% |
162 of 13,410 Lompoc households received food stamps within the past year. |
Los Alamos |
0.0% |
0 of 449 Los Alamos households received food stamps within the past year. |
Mission Canyon |
1.5% |
16 of 1,047 Mission Canyon households received food stamps within the past year. |
Mission Hills |
4.6% |
61 of 1,331 Mission Hills households received food stamps within the past year. |
Montecito |
2.2% |
69 of 3,209 Montecito households received food stamps within the past year. |
Orcutt |
1.0% |
111 of 10,805 Orcutt households received food stamps within the past year. |
Santa Barbara |
1.6% |
592 of 36,114 Santa Barbara households received food stamps within the past year. |
Santa Maria |
1.5% |
424 of 27,771 Santa Maria households received food stamps within the past year. |
Santa Ynez |
0.0% |
0 of 1,671 Santa Ynez households received food stamps within the past year. |
Solvang |
1.9% |
43 of 2,324 Solvang households received food stamps within the past year. |
Summerland |
0.0% |
0 of 606 Summerland households received food stamps within the past year. |
Toro Canyon |
0.0% |
0 of 625 Toro Canyon households received food stamps within the past year. |
Vandenberg AFB |
0.6% |
6 of 950 Vandenberg AFB households received food stamps within the past year. |
Vandenberg Village |
0.8% |
22 of 2,625 Vandenberg Village households received food stamps within the past year. |
