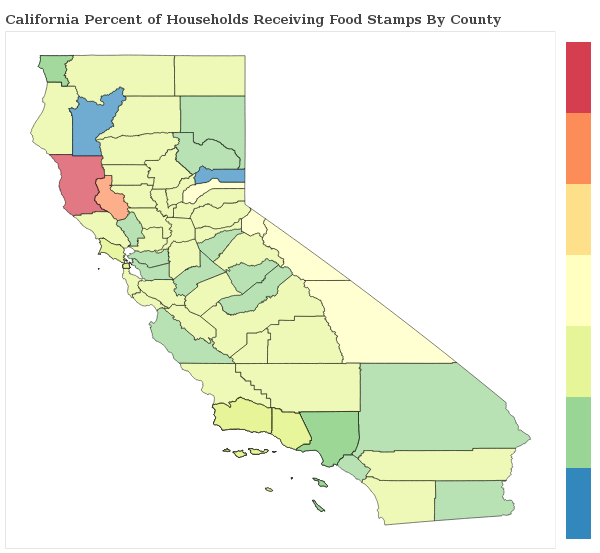
1.0% of Households Receive Food Stamps in Simi Valley, California
Food Stamps in Simi Valley, California
What percent of Households Receive Food Stamps in Simi Valley?
The percentage of households receiving food stamps in the last year in Simi Valley is 1.0%.
How Many Households in Simi Valley Receive Food Stamps?
There are 413 households out of 42025 in Simi Valley receiving food stamps.
Where does Simi Valley Rank in Comparison to Other California Cities for HouseHolds Receiving Food Stamps?
Simi Valley ranks 315th out of 1018 cities and towns in California for the least number of households receiving food stamps. A smaller numeric rank indicates a lower percentage of homes receive food stamps.
How do other cities in Ventura County compare to Simi Valley when it comes to the percentage of homes receiving Food Stamps?
Cities must have a minimum of 1,000 residents to qualify
| City | Food Stamps | Details |
|---|---|---|
Casa Conejo |
0.0% |
0 of 1,090 Casa Conejo households received food stamps within the past year. |
Channel Islands Beach |
0.0% |
0 of 1,114 Channel Islands Beach households received food stamps within the past year. |
Bell Canyon |
1.3% |
9 of 671 Bell Canyon households received food stamps within the past year. |
Camarillo |
1.1% |
282 of 24,640 Camarillo households received food stamps within the past year. |
El Rio |
1.7% |
29 of 1,664 El Rio households received food stamps within the past year. |
Fillmore |
2.0% |
84 of 4,300 Fillmore households received food stamps within the past year. |
Lake Sherwood |
1.3% |
9 of 698 Lake Sherwood households received food stamps within the past year. |
Meiners Oaks |
1.4% |
16 of 1,184 Meiners Oaks households received food stamps within the past year. |
Mira Monte |
0.3% |
9 of 2,711 Mira Monte households received food stamps within the past year. |
Moorpark |
1.1% |
127 of 11,178 Moorpark households received food stamps within the past year. |
Oak Park |
1.3% |
68 of 5,313 Oak Park households received food stamps within the past year. |
Oak View |
2.6% |
41 of 1,560 Oak View households received food stamps within the past year. |
Ojai |
2.8% |
82 of 2,928 Ojai households received food stamps within the past year. |
Oxnard |
1.9% |
970 of 51,108 Oxnard households received food stamps within the past year. |
Piru |
0.9% |
5 of 572 Piru households received food stamps within the past year. |
Port Hueneme |
1.9% |
123 of 6,565 Port Hueneme households received food stamps within the past year. |
San Buenaventura (Ventura) |
2.2% |
910 of 40,662 San Buenaventura (Ventura) households received food stamps within the past year. |
Santa Paula |
2.1% |
181 of 8,821 Santa Paula households received food stamps within the past year. |
Santa Rosa Valley |
0.0% |
0 of 1,176 Santa Rosa Valley households received food stamps within the past year. |
Santa Susana |
2.0% |
8 of 394 Santa Susana households received food stamps within the past year. |
Saticoy |
0.0% |
0 of 220 Saticoy households received food stamps within the past year. |
Simi Valley |
1.0% |
413 of 42,025 Simi Valley households received food stamps within the past year. |
Thousand Oaks |
1.3% |
589 of 46,136 Thousand Oaks households received food stamps within the past year. |
