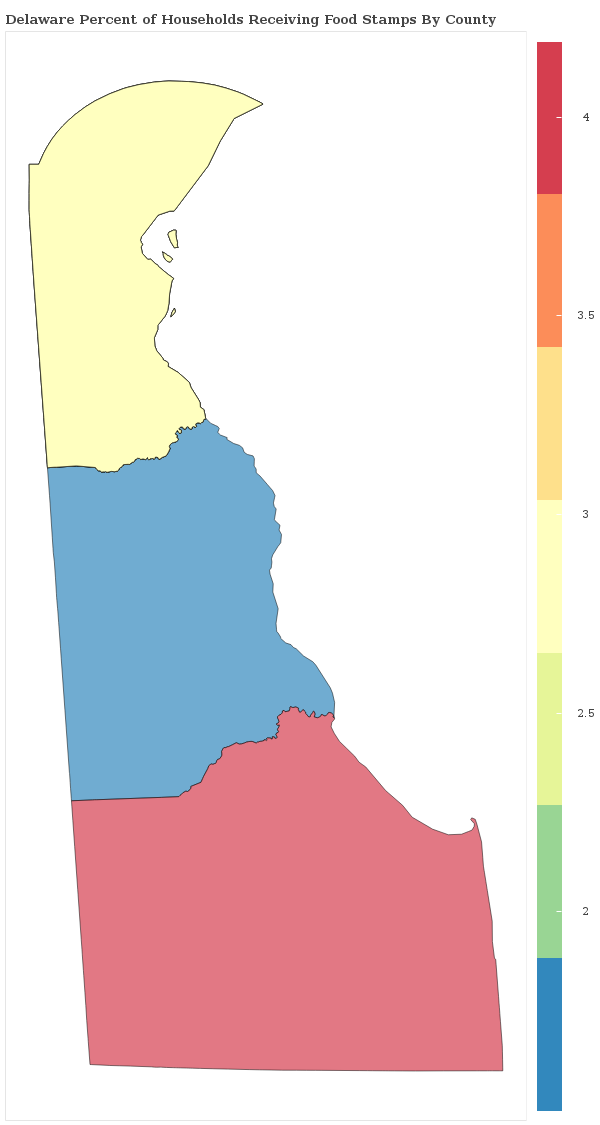
3.7% of Households Receive Food Stamps in Wilmington, Delaware
Food Stamps in Wilmington, Delaware
What percent of Households Receive Food Stamps in Wilmington?
The percentage of households receiving food stamps in the last year in Wilmington is 3.7%.
How Many Households in Wilmington Receive Food Stamps?
There are 1040 households out of 28484 in Wilmington receiving food stamps.
Where does Wilmington Rank in Comparison to Other Delaware Cities for HouseHolds Receiving Food Stamps?
Wilmington ranks 37th out of 52 cities and towns in Delaware for the least number of households receiving food stamps. A smaller numeric rank indicates a lower percentage of homes receive food stamps.
How do other cities in New Castle County compare to Wilmington when it comes to the percentage of homes receiving Food Stamps?
Cities must have a minimum of 1,000 residents to qualify
| City | Food Stamps | Details |
|---|---|---|
Middletown |
2.2% |
155 of 6,925 Middletown households received food stamps within the past year. |
Bear |
1.7% |
121 of 7,110 Bear households received food stamps within the past year. |
Bellefonte |
0.0% |
0 of 486 Bellefonte households received food stamps within the past year. |
Brookside |
4.1% |
204 of 4,991 Brookside households received food stamps within the past year. |
Claymont |
1.5% |
52 of 3,398 Claymont households received food stamps within the past year. |
Delaware City |
6.5% |
46 of 712 Delaware City households received food stamps within the past year. |
Edgemoor |
2.3% |
58 of 2,530 Edgemoor households received food stamps within the past year. |
Elsmere |
4.2% |
98 of 2,347 Elsmere households received food stamps within the past year. |
Glasgow |
0.5% |
24 of 5,180 Glasgow households received food stamps within the past year. |
Greenville |
2.3% |
26 of 1,112 Greenville households received food stamps within the past year. |
Hockessin |
1.0% |
48 of 4,796 Hockessin households received food stamps within the past year. |
Newark |
2.6% |
267 of 10,230 Newark households received food stamps within the past year. |
New Castle |
2.4% |
56 of 2,332 New Castle households received food stamps within the past year. |
Newport |
9.7% |
51 of 526 Newport households received food stamps within the past year. |
North Star |
2.8% |
76 of 2,704 North Star households received food stamps within the past year. |
Pike Creek |
0.9% |
29 of 3,340 Pike Creek households received food stamps within the past year. |
Pike Creek Valley |
2.1% |
98 of 4,628 Pike Creek Valley households received food stamps within the past year. |
Townsend |
4.9% |
28 of 572 Townsend households received food stamps within the past year. |
Wilmington |
3.7% |
1040 of 28,484 Wilmington households received food stamps within the past year. |
Wilmington Manor |
2.2% |
62 of 2,784 Wilmington Manor households received food stamps within the past year. |