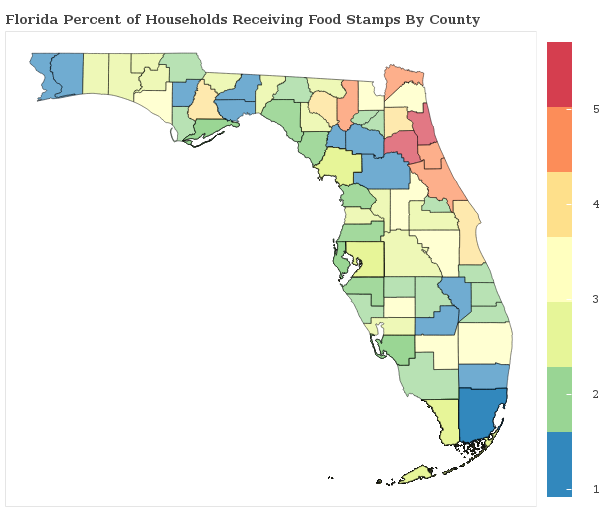
1.5% of Households Receive Food Stamps in Cape Coral, Florida
Food Stamps in Cape Coral, Florida
What percent of Households Receive Food Stamps in Cape Coral?
The percentage of households receiving food stamps in the last year in Cape Coral is 1.5%.
How Many Households in Cape Coral Receive Food Stamps?
There are 956 households out of 62392 in Cape Coral receiving food stamps.
Where does Cape Coral Rank in Comparison to Other Florida Cities for HouseHolds Receiving Food Stamps?
Cape Coral ranks 291st out of 740 cities and towns in Florida for the least number of households receiving food stamps. A smaller numeric rank indicates a lower percentage of homes receive food stamps.
How do other cities in Lee County compare to Cape Coral when it comes to the percentage of homes receiving Food Stamps?
Cities must have a minimum of 1,000 residents to qualify
| City | Food Stamps | Details |
|---|---|---|
Bonita Springs |
1.5% |
309 of 21,024 Bonita Springs households received food stamps within the past year. |
Buckingham |
3.9% |
59 of 1,522 Buckingham households received food stamps within the past year. |
Burnt Store Marina |
7.0% |
73 of 1,040 Burnt Store Marina households received food stamps within the past year. |
Cape Coral |
1.5% |
956 of 62,392 Cape Coral households received food stamps within the past year. |
Alva |
0.9% |
9 of 956 Alva households received food stamps within the past year. |
Bokeelia |
0.0% |
0 of 700 Bokeelia households received food stamps within the past year. |
Cypress Lake |
1.5% |
97 of 6,406 Cypress Lake households received food stamps within the past year. |
Estero |
0.6% |
82 of 14,567 Estero households received food stamps within the past year. |
Fort Myers |
2.3% |
619 of 27,313 Fort Myers households received food stamps within the past year. |
Fort Myers Beach |
2.2% |
82 of 3,664 Fort Myers Beach households received food stamps within the past year. |
Fort Myers Shores |
1.9% |
42 of 2,196 Fort Myers Shores households received food stamps within the past year. |
Gateway |
1.9% |
69 of 3,578 Gateway households received food stamps within the past year. |
Harlem Heights |
4.2% |
18 of 431 Harlem Heights households received food stamps within the past year. |
Iona |
1.3% |
93 of 7,407 Iona households received food stamps within the past year. |
Lehigh Acres |
1.3% |
414 of 32,609 Lehigh Acres households received food stamps within the past year. |
Lochmoor Waterway Estates |
6.5% |
119 of 1,822 Lochmoor Waterway Estates households received food stamps within the past year. |
McGregor |
3.2% |
113 of 3,492 McGregor households received food stamps within the past year. |
North Fort Myers |
2.5% |
481 of 19,165 North Fort Myers households received food stamps within the past year. |
Olga |
2.6% |
20 of 769 Olga households received food stamps within the past year. |
Palmona Park |
3.3% |
15 of 459 Palmona Park households received food stamps within the past year. |
Pine Island Center |
0.5% |
4 of 789 Pine Island Center households received food stamps within the past year. |
Pine Manor |
9.1% |
118 of 1,293 Pine Manor households received food stamps within the past year. |
Punta Rassa |
0.9% |
10 of 1,163 Punta Rassa households received food stamps within the past year. |
St. James City |
1.9% |
32 of 1,714 St. James City households received food stamps within the past year. |
San Carlos Park |
1.0% |
56 of 5,854 San Carlos Park households received food stamps within the past year. |
Sanibel |
1.1% |
40 of 3,575 Sanibel households received food stamps within the past year. |
Suncoast Estates |
3.8% |
61 of 1,606 Suncoast Estates households received food stamps within the past year. |
Three Oaks |
0.6% |
7 of 1,210 Three Oaks households received food stamps within the past year. |
Tice |
2.7% |
34 of 1,237 Tice households received food stamps within the past year. |
Villas |
1.0% |
49 of 5,016 Villas households received food stamps within the past year. |
Whiskey Creek |
0.7% |
16 of 2,204 Whiskey Creek households received food stamps within the past year. |
