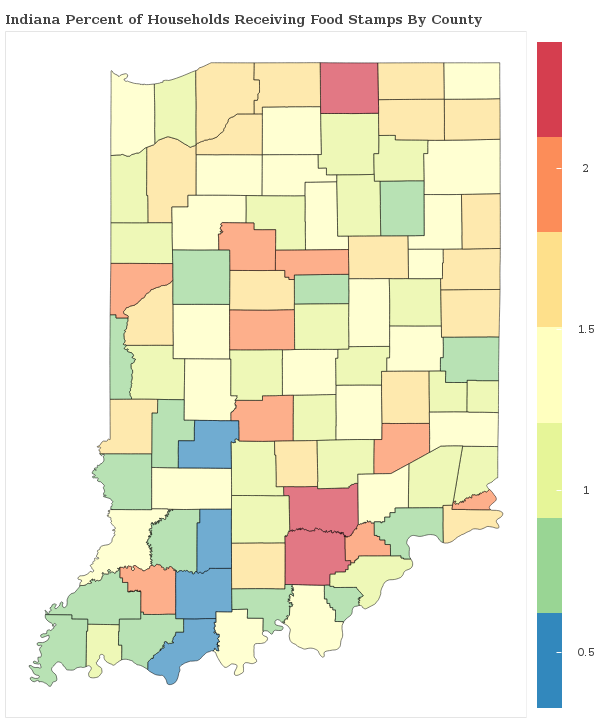
1.8% of Households Receive Food Stamps in Gary, Indiana
Food Stamps in Gary, Indiana
What percent of Households Receive Food Stamps in Gary?
The percentage of households receiving food stamps in the last year in Gary is 1.8%.
How Many Households in Gary Receive Food Stamps?
There are 553 households out of 31534 in Gary receiving food stamps.
Where does Gary Rank in Comparison to Other Indiana Cities for HouseHolds Receiving Food Stamps?
Gary ranks 243rd out of 340 cities and towns in Indiana for the least number of households receiving food stamps. A smaller numeric rank indicates a lower percentage of homes receive food stamps.
How do other cities in Lake County compare to Gary when it comes to the percentage of homes receiving Food Stamps?
Cities must have a minimum of 1,000 residents to qualify
| City | Food Stamps | Details |
|---|---|---|
Cedar Lake |
0.8% |
32 of 4,207 Cedar Lake households received food stamps within the past year. |
Crown Point |
1.6% |
180 of 11,168 Crown Point households received food stamps within the past year. |
Dyer |
1.3% |
76 of 6,016 Dyer households received food stamps within the past year. |
East Chicago |
1.0% |
99 of 10,256 East Chicago households received food stamps within the past year. |
Gary |
1.8% |
553 of 31,534 Gary households received food stamps within the past year. |
Griffith |
1.0% |
68 of 6,581 Griffith households received food stamps within the past year. |
Hammond |
1.5% |
431 of 28,425 Hammond households received food stamps within the past year. |
Highland |
1.2% |
117 of 9,533 Highland households received food stamps within the past year. |
Hobart |
1.7% |
186 of 11,198 Hobart households received food stamps within the past year. |
Lake Dalecarlia |
1.3% |
7 of 530 Lake Dalecarlia households received food stamps within the past year. |
Lake Station |
1.1% |
46 of 4,037 Lake Station households received food stamps within the past year. |
Lowell |
0.8% |
26 of 3,369 Lowell households received food stamps within the past year. |
Merrillville |
0.4% |
53 of 13,952 Merrillville households received food stamps within the past year. |
Munster |
0.6% |
55 of 8,756 Munster households received food stamps within the past year. |
New Chicago |
2.8% |
20 of 722 New Chicago households received food stamps within the past year. |
St. John |
1.3% |
74 of 5,683 St. John households received food stamps within the past year. |
Schererville |
0.4% |
44 of 11,643 Schererville households received food stamps within the past year. |
Whiting |
4.6% |
78 of 1,703 Whiting households received food stamps within the past year. |
Winfield |
0.0% |
0 of 1,699 Winfield households received food stamps within the past year. |
