1.4% of Households Receive Food Stamps in Frederick, Maryland
Food Stamps in Frederick, Maryland
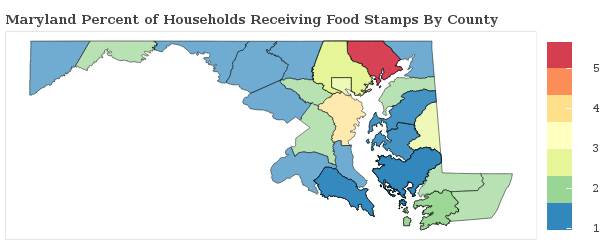
What percent of Households Receive Food Stamps in Frederick?
The percentage of households receiving food stamps in the last year in Frederick is 1.4%.
How Many Households in Frederick Receive Food Stamps?
There are 373 households out of 26987 in Frederick receiving food stamps.
Where does Frederick Rank in Comparison to Other Maryland Cities for HouseHolds Receiving Food Stamps?
Frederick ranks 153rd out of 305 cities and towns in Maryland for the least number of households receiving food stamps. A smaller numeric rank indicates a lower percentage of homes receive food stamps.
How do other cities in Frederick County compare to Frederick when it comes to the percentage of homes receiving Food Stamps?
Cities must have a minimum of 1,000 residents to qualify
| City | Food Stamps | Details |
|---|---|---|
Ballenger Creek |
1.1% |
78 of 7,408 Ballenger Creek households received food stamps within the past year. |
Adamstown |
0.0% |
0 of 776 Adamstown households received food stamps within the past year. |
Bartonsville |
2.4% |
12 of 492 Bartonsville households received food stamps within the past year. |
Braddock Heights |
0.7% |
8 of 1,102 Braddock Heights households received food stamps within the past year. |
Brunswick |
1.4% |
29 of 2,144 Brunswick households received food stamps within the past year. |
Buckeystown |
2.3% |
13 of 571 Buckeystown households received food stamps within the past year. |
Emmitsburg |
1.3% |
13 of 1,015 Emmitsburg households received food stamps within the past year. |
Frederick |
1.4% |
373 of 26,987 Frederick households received food stamps within the past year. |
Jefferson |
0.0% |
0 of 804 Jefferson households received food stamps within the past year. |
Libertytown |
1.6% |
7 of 430 Libertytown households received food stamps within the past year. |
Linganore |
0.4% |
13 of 3,274 Linganore households received food stamps within the past year. |
Middletown |
0.0% |
0 of 1,478 Middletown households received food stamps within the past year. |
Myersville |
0.0% |
0 of 567 Myersville households received food stamps within the past year. |
New Market |
1.1% |
4 of 379 New Market households received food stamps within the past year. |
Point of Rocks |
0.0% |
0 of 600 Point of Rocks households received food stamps within the past year. |
Spring Ridge |
1.5% |
32 of 2,194 Spring Ridge households received food stamps within the past year. |
Thurmont |
0.9% |
22 of 2,554 Thurmont households received food stamps within the past year. |
Urbana |
1.4% |
46 of 3,341 Urbana households received food stamps within the past year. |
Walkersville |
2.2% |
49 of 2,200 Walkersville households received food stamps within the past year. |
Woodsboro |
0.9% |
4 of 436 Woodsboro households received food stamps within the past year. |