1.5% of Households Receive Food Stamps in Gaithersburg, Maryland
Food Stamps in Gaithersburg, Maryland
What percent of Households Receive Food Stamps in Gaithersburg?
The percentage of households receiving food stamps in the last year in Gaithersburg is 1.5%.
How Many Households in Gaithersburg Receive Food Stamps?
There are 356 households out of 24377 in Gaithersburg receiving food stamps.
Where does Gaithersburg Rank in Comparison to Other Maryland Cities for HouseHolds Receiving Food Stamps?
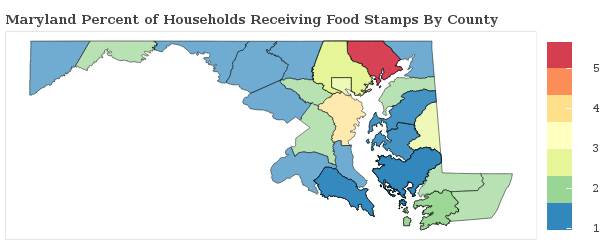
Gaithersburg ranks 161st out of 305 cities and towns in Maryland for the least number of households receiving food stamps. A smaller numeric rank indicates a lower percentage of homes receive food stamps.
How do other cities in Montgomery County compare to Gaithersburg when it comes to the percentage of homes receiving Food Stamps?
Cities must have a minimum of 1,000 residents to qualify
| City | Food Stamps | Details |
|---|---|---|
Ashton-Sandy Spring |
0.6% |
12 of 1,900 Ashton-Sandy Spring households received food stamps within the past year. |
Aspen Hill |
2.0% |
334 of 16,799 Aspen Hill households received food stamps within the past year. |
Bethesda |
1.1% |
269 of 25,273 Bethesda households received food stamps within the past year. |
Brookmont |
1.2% |
15 of 1,300 Brookmont households received food stamps within the past year. |
Burtonsville |
0.9% |
29 of 3,110 Burtonsville households received food stamps within the past year. |
Cabin John |
0.0% |
0 of 854 Cabin John households received food stamps within the past year. |
Chevy Chase |
0.9% |
9 of 1,019 Chevy Chase households received food stamps within the past year. |
Chevy Chase Village |
1.5% |
10 of 669 Chevy Chase Village households received food stamps within the past year. |
Clarksburg |
0.5% |
35 of 6,463 Clarksburg households received food stamps within the past year. |
Cloverly |
0.6% |
27 of 4,849 Cloverly households received food stamps within the past year. |
Colesville |
1.2% |
57 of 4,770 Colesville households received food stamps within the past year. |
Damascus |
1.7% |
82 of 4,880 Damascus households received food stamps within the past year. |
Darnestown |
0.7% |
16 of 2,209 Darnestown households received food stamps within the past year. |
Derwood |
0.0% |
0 of 820 Derwood households received food stamps within the past year. |
Fairland |
0.9% |
83 of 8,779 Fairland households received food stamps within the past year. |
Forest Glen |
0.3% |
8 of 2,570 Forest Glen households received food stamps within the past year. |
Four Corners |
0.9% |
26 of 2,791 Four Corners households received food stamps within the past year. |
Friendship Heights Village |
0.3% |
10 of 2,961 Friendship Heights Village households received food stamps within the past year. |
Gaithersburg |
1.5% |
356 of 24,377 Gaithersburg households received food stamps within the past year. |
Garrett Park |
0.0% |
0 of 364 Garrett Park households received food stamps within the past year. |
Germantown |
1.5% |
477 of 31,230 Germantown households received food stamps within the past year. |
Glenmont |
0.6% |
32 of 5,292 Glenmont households received food stamps within the past year. |
Kemp Mill |
0.5% |
23 of 4,481 Kemp Mill households received food stamps within the past year. |
Kensington |
1.1% |
9 of 814 Kensington households received food stamps within the past year. |
Layhill |
0.0% |
0 of 1,610 Layhill households received food stamps within the past year. |
Leisure World |
1.7% |
102 of 5,985 Leisure World households received food stamps within the past year. |
Montgomery Village |
1.3% |
155 of 11,750 Montgomery Village households received food stamps within the past year. |
North Bethesda |
0.6% |
136 of 21,272 North Bethesda households received food stamps within the past year. |
North Kensington |
0.7% |
24 of 3,502 North Kensington households received food stamps within the past year. |
North Potomac |
1.0% |
77 of 7,970 North Potomac households received food stamps within the past year. |
Olney |
1.5% |
176 of 11,684 Olney households received food stamps within the past year. |
Poolesville |
3.2% |
49 of 1,526 Poolesville households received food stamps within the past year. |
Potomac |
1.2% |
187 of 16,121 Potomac households received food stamps within the past year. |
Redland |
3.0% |
165 of 5,494 Redland households received food stamps within the past year. |
Rockville |
1.0% |
237 of 24,874 Rockville households received food stamps within the past year. |
Silver Spring |
1.1% |
360 of 31,318 Silver Spring households received food stamps within the past year. |
Somerset |
0.0% |
0 of 403 Somerset households received food stamps within the past year. |
South Kensington |
1.2% |
37 of 3,018 South Kensington households received food stamps within the past year. |
Spencerville |
0.0% |
0 of 638 Spencerville households received food stamps within the past year. |
Takoma Park |
1.1% |
69 of 6,396 Takoma Park households received food stamps within the past year. |
Travilah |
1.5% |
55 of 3,670 Travilah households received food stamps within the past year. |
Wheaton |
1.8% |
277 of 15,232 Wheaton households received food stamps within the past year. |
White Oak |
1.6% |
107 of 6,858 White Oak households received food stamps within the past year. |