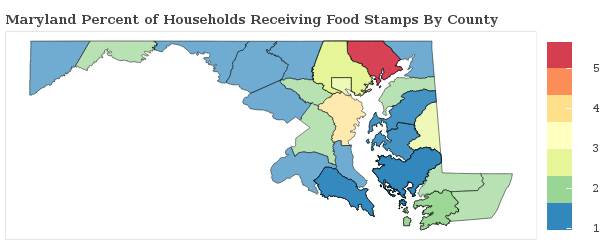
4.3% of Households Receive Food Stamps in Glen Burnie, Maryland
Food Stamps in Glen Burnie, Maryland
What percent of Households Receive Food Stamps in Glen Burnie?
The percentage of households receiving food stamps in the last year in Glen Burnie is 4.3%.
How Many Households in Glen Burnie Receive Food Stamps?
There are 1142 households out of 26799 in Glen Burnie receiving food stamps.
Where does Glen Burnie Rank in Comparison to Other Maryland Cities for HouseHolds Receiving Food Stamps?
Glen Burnie ranks 274th out of 305 cities and towns in Maryland for the least number of households receiving food stamps. A smaller numeric rank indicates a lower percentage of homes receive food stamps.
How do other cities in Anne Arundel County compare to Glen Burnie when it comes to the percentage of homes receiving Food Stamps?
Cities must have a minimum of 1,000 residents to qualify
| City | Food Stamps | Details |
|---|---|---|
Annapolis |
4.0% |
633 of 15,684 Annapolis households received food stamps within the past year. |
Annapolis Neck |
1.3% |
60 of 4,551 Annapolis Neck households received food stamps within the past year. |
Arden on the Severn |
2.4% |
20 of 831 Arden on the Severn households received food stamps within the past year. |
Arnold |
3.5% |
287 of 8,200 Arnold households received food stamps within the past year. |
Brooklyn Park |
8.8% |
468 of 5,326 Brooklyn Park households received food stamps within the past year. |
Cape St. Claire |
1.4% |
45 of 3,227 Cape St. Claire households received food stamps within the past year. |
Crofton |
2.9% |
294 of 10,309 Crofton households received food stamps within the past year. |
Crownsville |
9.4% |
58 of 615 Crownsville households received food stamps within the past year. |
Deale |
0.0% |
0 of 1,858 Deale households received food stamps within the past year. |
Edgewater |
0.7% |
26 of 3,869 Edgewater households received food stamps within the past year. |
Ferndale |
6.5% |
412 of 6,351 Ferndale households received food stamps within the past year. |
Fort Meade |
2.2% |
59 of 2,630 Fort Meade households received food stamps within the past year. |
Gambrills |
1.7% |
16 of 949 Gambrills households received food stamps within the past year. |
Glen Burnie |
4.3% |
1142 of 26,799 Glen Burnie households received food stamps within the past year. |
Herald Harbor |
7.6% |
75 of 988 Herald Harbor households received food stamps within the past year. |
Lake Shore |
5.0% |
350 of 6,971 Lake Shore households received food stamps within the past year. |
Linthicum |
3.7% |
138 of 3,767 Linthicum households received food stamps within the past year. |
Maryland City |
8.8% |
580 of 6,581 Maryland City households received food stamps within the past year. |
Mayo |
3.4% |
106 of 3,111 Mayo households received food stamps within the past year. |
Naval Academy |
0.0% |
0 of 101 Naval Academy households received food stamps within the past year. |
Odenton |
3.9% |
626 of 15,858 Odenton households received food stamps within the past year. |
Parole |
3.0% |
243 of 8,080 Parole households received food stamps within the past year. |
Pasadena |
5.2% |
500 of 9,612 Pasadena households received food stamps within the past year. |
Riva |
0.8% |
11 of 1,383 Riva households received food stamps within the past year. |
Riviera Beach |
7.5% |
362 of 4,821 Riviera Beach households received food stamps within the past year. |
Severn |
4.4% |
769 of 17,624 Severn households received food stamps within the past year. |
Severna Park |
3.8% |
503 of 13,105 Severna Park households received food stamps within the past year. |
Shady Side |
1.0% |
21 of 2,169 Shady Side households received food stamps within the past year. |
