1.5% of Households Receive Food Stamps in Henderson, Nevada
Food Stamps in Henderson, Nevada
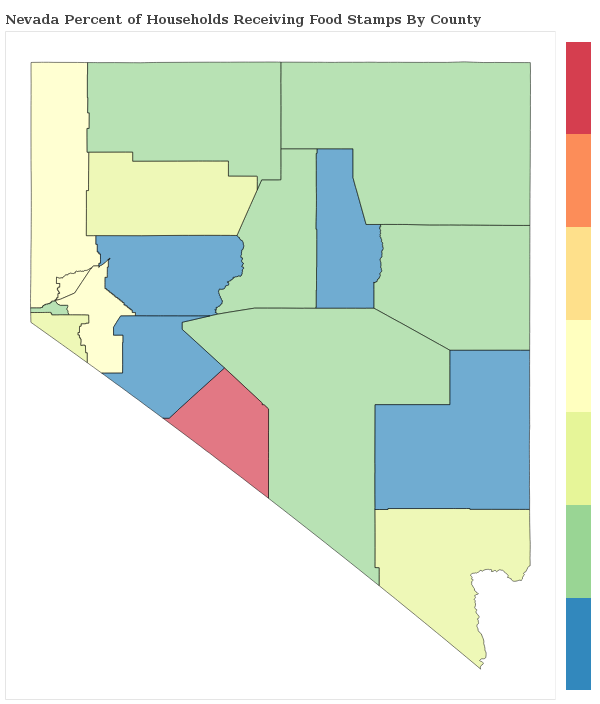
What percent of Households Receive Food Stamps in Henderson?
The percentage of households receiving food stamps in the last year in Henderson is 1.5%.
How Many Households in Henderson Receive Food Stamps?
There are 1629 households out of 110569 in Henderson receiving food stamps.
Where does Henderson Rank in Comparison to Other Nevada Cities for HouseHolds Receiving Food Stamps?
Henderson ranks 39th out of 65 cities and towns in Nevada for the least number of households receiving food stamps. A smaller numeric rank indicates a lower percentage of homes receive food stamps.
How do other cities in Clark County compare to Henderson when it comes to the percentage of homes receiving Food Stamps?
Cities must have a minimum of 1,000 residents to qualify
| City | Food Stamps | Details |
|---|---|---|
Boulder City |
1.9% |
124 of 6,403 Boulder City households received food stamps within the past year. |
Bunkerville |
0.0% |
0 of 320 Bunkerville households received food stamps within the past year. |
Enterprise |
1.3% |
688 of 52,366 Enterprise households received food stamps within the past year. |
Henderson |
1.5% |
1629 of 110,569 Henderson households received food stamps within the past year. |
Las Vegas |
1.2% |
2611 of 221,584 Las Vegas households received food stamps within the past year. |
Laughlin |
2.6% |
102 of 3,904 Laughlin households received food stamps within the past year. |
Mesquite |
1.0% |
76 of 7,729 Mesquite households received food stamps within the past year. |
Moapa Town |
5.4% |
15 of 279 Moapa Town households received food stamps within the past year. |
Moapa Valley |
0.6% |
13 of 2,258 Moapa Valley households received food stamps within the past year. |
Nellis AFB |
4.0% |
36 of 895 Nellis AFB households received food stamps within the past year. |
North Las Vegas |
1.3% |
916 of 70,121 North Las Vegas households received food stamps within the past year. |
Paradise |
1.1% |
1001 of 88,842 Paradise households received food stamps within the past year. |
Sandy Valley |
2.7% |
13 of 487 Sandy Valley households received food stamps within the past year. |
Spring Valley |
1.2% |
913 of 73,342 Spring Valley households received food stamps within the past year. |
Summerlin South |
0.6% |
71 of 10,926 Summerlin South households received food stamps within the past year. |
Sunrise Manor |
1.8% |
1133 of 62,103 Sunrise Manor households received food stamps within the past year. |
Whitney |
1.3% |
199 of 14,875 Whitney households received food stamps within the past year. |
Winchester |
1.1% |
118 of 11,200 Winchester households received food stamps within the past year. |