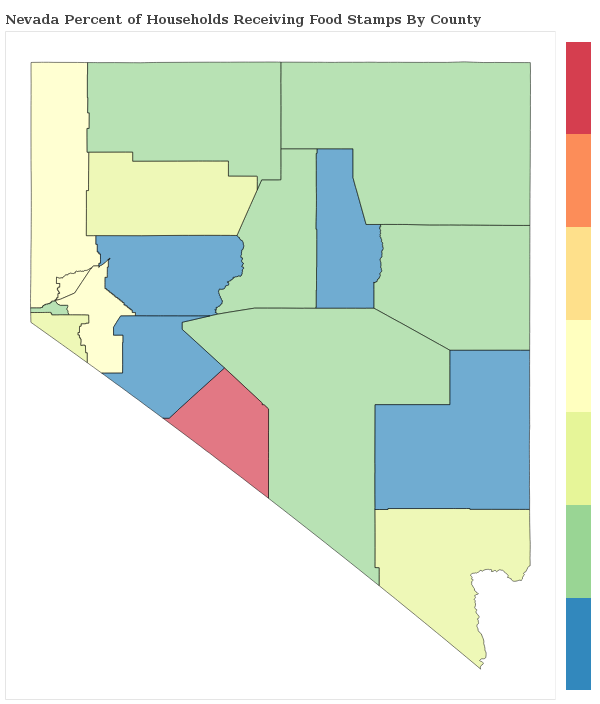
1.9% of Households Receive Food Stamps in Reno, Nevada
Food Stamps in Reno, Nevada
What percent of Households Receive Food Stamps in Reno?
The percentage of households receiving food stamps in the last year in Reno is 1.9%.
How Many Households in Reno Receive Food Stamps?
There are 1845 households out of 96411 in Reno receiving food stamps.
Where does Reno Rank in Comparison to Other Nevada Cities for HouseHolds Receiving Food Stamps?
Reno ranks 53rd out of 65 cities and towns in Nevada for the least number of households receiving food stamps. A smaller numeric rank indicates a lower percentage of homes receive food stamps.
How do other cities in Washoe County compare to Reno when it comes to the percentage of homes receiving Food Stamps?
Cities must have a minimum of 1,000 residents to qualify
| City | Food Stamps | Details |
|---|---|---|
Cold Springs |
1.9% |
59 of 3,110 Cold Springs households received food stamps within the past year. |
Golden Valley |
0.0% |
0 of 572 Golden Valley households received food stamps within the past year. |
Incline Village |
1.6% |
60 of 3,683 Incline Village households received food stamps within the past year. |
Lemmon Valley |
1.5% |
27 of 1,827 Lemmon Valley households received food stamps within the past year. |
Mogul |
1.9% |
13 of 689 Mogul households received food stamps within the past year. |
Reno |
1.9% |
1845 of 96,411 Reno households received food stamps within the past year. |
Spanish Springs |
1.7% |
98 of 5,638 Spanish Springs households received food stamps within the past year. |
Sparks |
1.8% |
674 of 37,030 Sparks households received food stamps within the past year. |
Sun Valley |
2.9% |
189 of 6,615 Sun Valley households received food stamps within the past year. |
Verdi |
2.2% |
13 of 600 Verdi households received food stamps within the past year. |
Washoe Valley |
1.7% |
22 of 1,281 Washoe Valley households received food stamps within the past year. |
