1.9% of Households Receive Food Stamps in Newark, New Jersey
Food Stamps in Newark, New Jersey
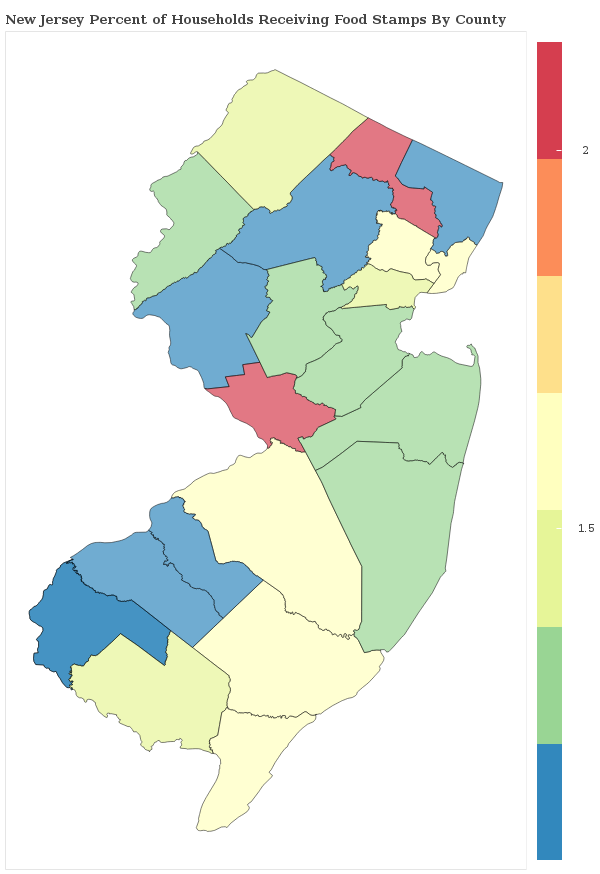
What percent of Households Receive Food Stamps in Newark?
The percentage of households receiving food stamps in the last year in Newark is 1.9%.
How Many Households in Newark Receive Food Stamps?
There are 1806 households out of 95316 in Newark receiving food stamps.
Where does Newark Rank in Comparison to Other New Jersey Cities for HouseHolds Receiving Food Stamps?
Newark ranks 362nd out of 461 cities and towns in New Jersey for the least number of households receiving food stamps. A smaller numeric rank indicates a lower percentage of homes receive food stamps.
How do other cities in Essex County compare to Newark when it comes to the percentage of homes receiving Food Stamps?
Cities must have a minimum of 1,000 residents to qualify
| City | Food Stamps | Details |
|---|---|---|
Brookdale |
0.6% |
19 of 3,335 Brookdale households received food stamps within the past year. |
Caldwell |
1.4% |
46 of 3,315 Caldwell households received food stamps within the past year. |
East Orange |
2.2% |
537 of 24,195 East Orange households received food stamps within the past year. |
Essex Fells |
1.6% |
12 of 735 Essex Fells households received food stamps within the past year. |
Glen Ridge |
0.9% |
21 of 2,459 Glen Ridge households received food stamps within the past year. |
Newark |
1.9% |
1806 of 95,316 Newark households received food stamps within the past year. |
North Caldwell |
0.0% |
0 of 2,317 North Caldwell households received food stamps within the past year. |
Roseland |
0.6% |
15 of 2,415 Roseland households received food stamps within the past year. |
Short Hills |
1.3% |
54 of 4,057 Short Hills households received food stamps within the past year. |
Silver Lake |
2.1% |
33 of 1,564 Silver Lake households received food stamps within the past year. |
Upper Montclair |
1.0% |
40 of 3,999 Upper Montclair households received food stamps within the past year. |