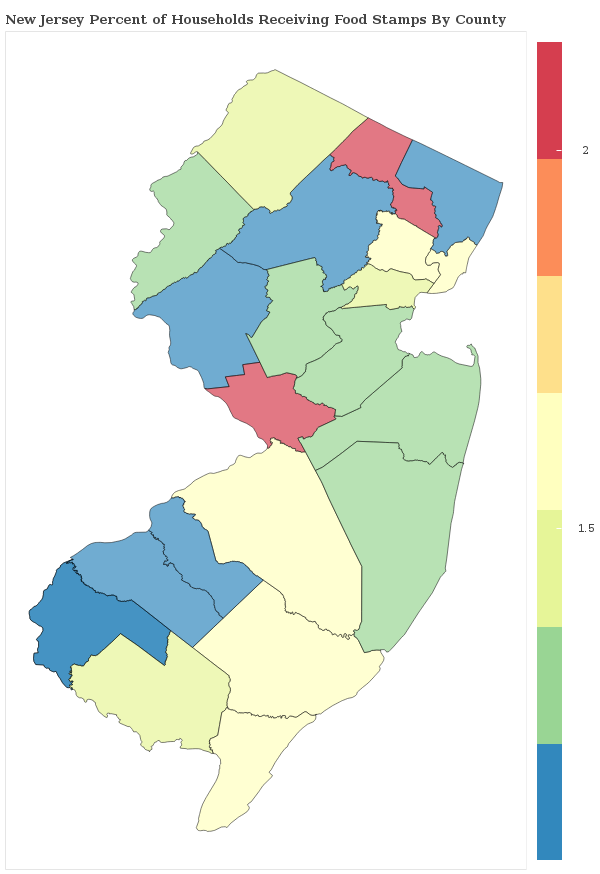
1.3% of Households Receive Food Stamps in Toms River, New Jersey
Food Stamps in Toms River, New Jersey
What percent of Households Receive Food Stamps in Toms River?
The percentage of households receiving food stamps in the last year in Toms River is 1.3%.
How Many Households in Toms River Receive Food Stamps?
There are 420 households out of 33330 in Toms River receiving food stamps.
Where does Toms River Rank in Comparison to Other New Jersey Cities for HouseHolds Receiving Food Stamps?
Toms River ranks 239th out of 461 cities and towns in New Jersey for the least number of households receiving food stamps. A smaller numeric rank indicates a lower percentage of homes receive food stamps.
How do other cities in Ocean County compare to Toms River when it comes to the percentage of homes receiving Food Stamps?
Cities must have a minimum of 1,000 residents to qualify
| City | Food Stamps | Details |
|---|---|---|
Cedar Glen Lakes |
2.7% |
29 of 1,089 Cedar Glen Lakes households received food stamps within the past year. |
Cedar Glen West |
3.3% |
26 of 784 Cedar Glen West households received food stamps within the past year. |
Barnegat |
1.5% |
16 of 1,069 Barnegat households received food stamps within the past year. |
Bay Head |
1.3% |
6 of 446 Bay Head households received food stamps within the past year. |
Beach Haven |
4.1% |
23 of 565 Beach Haven households received food stamps within the past year. |
Beach Haven West |
0.0% |
0 of 1,725 Beach Haven West households received food stamps within the past year. |
Beachwood |
0.7% |
25 of 3,715 Beachwood households received food stamps within the past year. |
Crestwood Village |
2.6% |
147 of 5,574 Crestwood Village households received food stamps within the past year. |
Dover Beaches North |
1.2% |
10 of 809 Dover Beaches North households received food stamps within the past year. |
Dover Beaches South |
3.3% |
20 of 602 Dover Beaches South households received food stamps within the past year. |
Forked River |
2.1% |
42 of 1,973 Forked River households received food stamps within the past year. |
Holiday City-Berkeley |
1.2% |
87 of 7,507 Holiday City-Berkeley households received food stamps within the past year. |
Holiday City South |
1.7% |
36 of 2,180 Holiday City South households received food stamps within the past year. |
Holiday Heights |
5.5% |
68 of 1,231 Holiday Heights households received food stamps within the past year. |
Island Heights |
0.8% |
5 of 666 Island Heights households received food stamps within the past year. |
Lakehurst |
2.2% |
19 of 876 Lakehurst households received food stamps within the past year. |
Lakewood |
1.2% |
125 of 10,420 Lakewood households received food stamps within the past year. |
Lavallette |
1.1% |
11 of 1,003 Lavallette households received food stamps within the past year. |
Leisure Knoll |
3.4% |
50 of 1,473 Leisure Knoll households received food stamps within the past year. |
Leisure Village |
3.2% |
80 of 2,510 Leisure Village households received food stamps within the past year. |
Leisure Village East |
1.0% |
24 of 2,368 Leisure Village East households received food stamps within the past year. |
Manahawkin |
0.9% |
8 of 931 Manahawkin households received food stamps within the past year. |
Mystic Island |
1.4% |
51 of 3,523 Mystic Island households received food stamps within the past year. |
New Egypt |
1.6% |
14 of 889 New Egypt households received food stamps within the past year. |
North Beach Haven |
0.6% |
7 of 1,093 North Beach Haven households received food stamps within the past year. |
Ocean Acres |
1.1% |
64 of 5,697 Ocean Acres households received food stamps within the past year. |
Ocean Gate |
0.0% |
0 of 764 Ocean Gate households received food stamps within the past year. |
Pine Beach |
0.6% |
5 of 816 Pine Beach households received food stamps within the past year. |
Pine Lake Park |
0.0% |
0 of 2,888 Pine Lake Park households received food stamps within the past year. |
Pine Ridge at Crestwood |
1.8% |
27 of 1,460 Pine Ridge at Crestwood households received food stamps within the past year. |
Point Pleasant |
0.3% |
25 of 7,316 Point Pleasant households received food stamps within the past year. |
Point Pleasant Beach |
0.7% |
13 of 1,982 Point Pleasant Beach households received food stamps within the past year. |
Seaside Heights |
0.0% |
0 of 1,109 Seaside Heights households received food stamps within the past year. |
Seaside Park |
0.0% |
0 of 831 Seaside Park households received food stamps within the past year. |
Silver Ridge |
3.3% |
27 of 818 Silver Ridge households received food stamps within the past year. |
South Toms River |
1.7% |
17 of 1,002 South Toms River households received food stamps within the past year. |
Surf City |
0.5% |
3 of 602 Surf City households received food stamps within the past year. |
Toms River |
1.3% |
420 of 33,330 Toms River households received food stamps within the past year. |
Tuckerton |
1.6% |
22 of 1,389 Tuckerton households received food stamps within the past year. |
Vista Center |
2.1% |
21 of 978 Vista Center households received food stamps within the past year. |
Waretown |
6.1% |
52 of 846 Waretown households received food stamps within the past year. |
