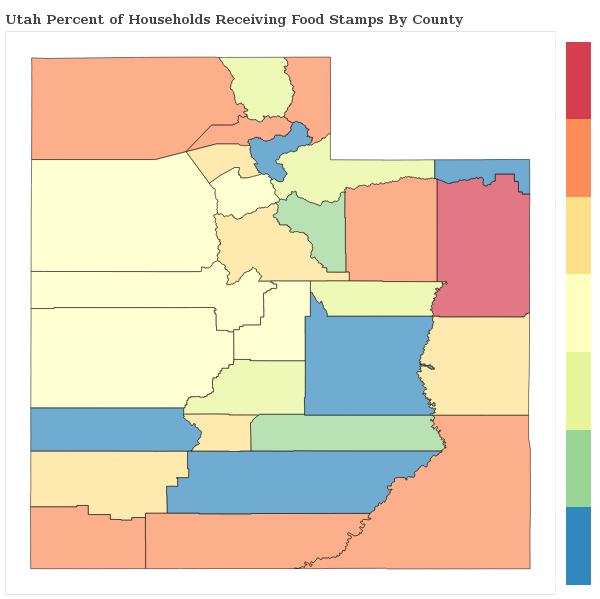
2.2% of Households Receive Food Stamps in Ogden, Utah
Food Stamps in Ogden, Utah
What percent of Households Receive Food Stamps in Ogden?
The percentage of households receiving food stamps in the last year in Ogden is 2.2%.
How Many Households in Ogden Receive Food Stamps?
There are 669 households out of 30154 in Ogden receiving food stamps.
Where does Ogden Rank in Comparison to Other Utah Cities for HouseHolds Receiving Food Stamps?
Ogden ranks 145th out of 164 cities and towns in Utah for the least number of households receiving food stamps. A smaller numeric rank indicates a lower percentage of homes receive food stamps.
How do other cities in Weber County compare to Ogden when it comes to the percentage of homes receiving Food Stamps?
Cities must have a minimum of 1,000 residents to qualify
| City | Food Stamps | Details |
|---|---|---|
Farr West |
2.3% |
46 of 2,036 Farr West households received food stamps within the past year. |
Harrisville |
0.9% |
18 of 1,928 Harrisville households received food stamps within the past year. |
Hooper |
0.6% |
15 of 2,339 Hooper households received food stamps within the past year. |
Liberty |
0.0% |
0 of 457 Liberty households received food stamps within the past year. |
Marriott-Slaterville |
3.0% |
19 of 644 Marriott-Slaterville households received food stamps within the past year. |
North Ogden |
1.2% |
70 of 5,777 North Ogden households received food stamps within the past year. |
Ogden |
2.2% |
669 of 30,154 Ogden households received food stamps within the past year. |
Plain City |
1.8% |
30 of 1,704 Plain City households received food stamps within the past year. |
Pleasant View |
3.6% |
95 of 2,613 Pleasant View households received food stamps within the past year. |
Riverdale |
1.0% |
34 of 3,267 Riverdale households received food stamps within the past year. |
Roy |
0.8% |
93 of 12,217 Roy households received food stamps within the past year. |
South Ogden |
3.2% |
197 of 6,149 South Ogden households received food stamps within the past year. |
Uintah |
0.6% |
3 of 501 Uintah households received food stamps within the past year. |
Washington Terrace |
0.6% |
19 of 3,258 Washington Terrace households received food stamps within the past year. |
West Haven |
1.6% |
61 of 3,772 West Haven households received food stamps within the past year. |
Wolf Creek |
0.0% |
0 of 491 Wolf Creek households received food stamps within the past year. |
