1.3% of Households Receive Food Stamps in Bellevue, Washington
Food Stamps in Bellevue, Washington
What percent of Households Receive Food Stamps in Bellevue?
The percentage of households receiving food stamps in the last year in Bellevue is 1.3%.
How Many Households in Bellevue Receive Food Stamps?
There are 734 households out of 55691 in Bellevue receiving food stamps.
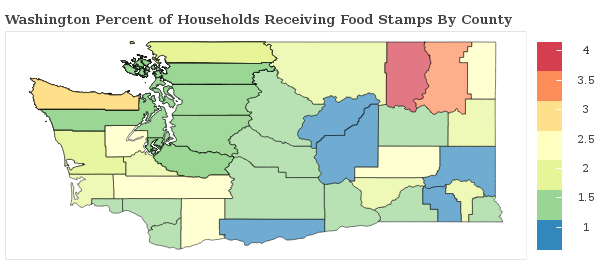
Where does Bellevue Rank in Comparison to Other Washington Cities for HouseHolds Receiving Food Stamps?
Bellevue ranks 204th out of 383 cities and towns in Washington for the least number of households receiving food stamps. A smaller numeric rank indicates a lower percentage of homes receive food stamps.
How do other cities in King County compare to Bellevue when it comes to the percentage of homes receiving Food Stamps?
Cities must have a minimum of 1,000 residents to qualify
| City | Food Stamps | Details |
|---|---|---|
Black Diamond |
0.9% |
16 of 1,686 Black Diamond households received food stamps within the past year. |
Ames Lake |
0.0% |
0 of 557 Ames Lake households received food stamps within the past year. |
Bellevue |
1.3% |
734 of 55,691 Bellevue households received food stamps within the past year. |
Algona |
10.2% |
95 of 933 Algona households received food stamps within the past year. |
Boulevard Park |
1.9% |
32 of 1,695 Boulevard Park households received food stamps within the past year. |
Bryn Mawr-Skyway |
2.5% |
160 of 6,484 Bryn Mawr-Skyway households received food stamps within the past year. |
Burien |
2.0% |
371 of 18,606 Burien households received food stamps within the past year. |
Carnation |
0.0% |
0 of 644 Carnation households received food stamps within the past year. |
Clyde Hill |
2.1% |
23 of 1,120 Clyde Hill households received food stamps within the past year. |
Cottage Lake |
1.5% |
123 of 8,113 Cottage Lake households received food stamps within the past year. |
Covington |
1.1% |
78 of 7,010 Covington households received food stamps within the past year. |
Des Moines |
2.1% |
246 of 11,704 Des Moines households received food stamps within the past year. |
Duvall |
0.5% |
14 of 2,593 Duvall households received food stamps within the past year. |
East Renton Highlands |
1.5% |
64 of 4,333 East Renton Highlands households received food stamps within the past year. |
Fairwood |
2.1% |
156 of 7,330 Fairwood households received food stamps within the past year. |
Fall City |
0.0% |
0 of 769 Fall City households received food stamps within the past year. |
Federal Way |
2.0% |
683 of 34,755 Federal Way households received food stamps within the past year. |
Hobart |
0.0% |
0 of 2,562 Hobart households received food stamps within the past year. |
Issaquah |
1.3% |
187 of 14,550 Issaquah households received food stamps within the past year. |
Kenmore |
1.2% |
100 of 8,644 Kenmore households received food stamps within the past year. |
Kent |
3.1% |
1328 of 43,509 Kent households received food stamps within the past year. |
Kirkland |
0.9% |
338 of 36,127 Kirkland households received food stamps within the past year. |
Lake Forest Park |
1.4% |
73 of 5,194 Lake Forest Park households received food stamps within the past year. |
Lake Holm |
0.0% |
0 of 1,212 Lake Holm households received food stamps within the past year. |
Lakeland North |
5.6% |
247 of 4,378 Lakeland North households received food stamps within the past year. |
Lakeland South |
3.0% |
143 of 4,693 Lakeland South households received food stamps within the past year. |
Lake Marcel-Stillwater |
3.5% |
18 of 510 Lake Marcel-Stillwater households received food stamps within the past year. |
Lake Morton-Berrydale |
2.5% |
100 of 3,934 Lake Morton-Berrydale households received food stamps within the past year. |
Maple Heights-Lake Desire |
0.0% |
0 of 1,297 Maple Heights-Lake Desire households received food stamps within the past year. |
Maple Valley |
1.2% |
103 of 8,656 Maple Valley households received food stamps within the past year. |
Medina |
2.1% |
25 of 1,175 Medina households received food stamps within the past year. |
Mercer Island |
0.5% |
45 of 9,867 Mercer Island households received food stamps within the past year. |
Mirrormont |
0.6% |
8 of 1,358 Mirrormont households received food stamps within the past year. |
Newcastle |
0.7% |
31 of 4,284 Newcastle households received food stamps within the past year. |
Normandy Park |
0.3% |
9 of 2,807 Normandy Park households received food stamps within the past year. |
North Bend |
1.1% |
26 of 2,387 North Bend households received food stamps within the past year. |
Ravensdale |
3.4% |
20 of 584 Ravensdale households received food stamps within the past year. |
Redmond |
1.2% |
295 of 24,514 Redmond households received food stamps within the past year. |
Renton |
1.1% |
429 of 38,563 Renton households received food stamps within the past year. |
Riverbend |
0.0% |
0 of 835 Riverbend households received food stamps within the past year. |
Sammamish |
1.4% |
283 of 20,855 Sammamish households received food stamps within the past year. |
SeaTac |
3.4% |
338 of 9,857 SeaTac households received food stamps within the past year. |
Seattle |
1.4% |
4551 of 314,850 Seattle households received food stamps within the past year. |
Shadow Lake |
0.0% |
0 of 964 Shadow Lake households received food stamps within the past year. |
Shoreline |
1.3% |
290 of 21,930 Shoreline households received food stamps within the past year. |
Snoqualmie |
0.0% |
0 of 4,179 Snoqualmie households received food stamps within the past year. |
Tukwila |
1.3% |
92 of 7,123 Tukwila households received food stamps within the past year. |
Union Hill-Novelty Hill |
1.1% |
91 of 8,044 Union Hill-Novelty Hill households received food stamps within the past year. |
Vashon |
0.8% |
35 of 4,407 Vashon households received food stamps within the past year. |
White Center |
2.1% |
115 of 5,528 White Center households received food stamps within the past year. |
Wilderness Rim |
2.2% |
13 of 590 Wilderness Rim households received food stamps within the past year. |
Woodinville |
0.5% |
23 of 4,742 Woodinville households received food stamps within the past year. |
Yarrow Point |
0.0% |
0 of 430 Yarrow Point households received food stamps within the past year. |