1.0% of Households Receive Food Stamps in Everett, Washington
Food Stamps in Everett, Washington
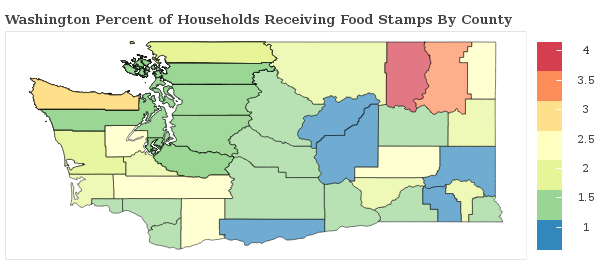
What percent of Households Receive Food Stamps in Everett?
The percentage of households receiving food stamps in the last year in Everett is 1.0%.
How Many Households in Everett Receive Food Stamps?
There are 437 households out of 42652 in Everett receiving food stamps.
Where does Everett Rank in Comparison to Other Washington Cities for HouseHolds Receiving Food Stamps?
Everett ranks 151st out of 383 cities and towns in Washington for the least number of households receiving food stamps. A smaller numeric rank indicates a lower percentage of homes receive food stamps.
How do other cities in Snohomish County compare to Everett when it comes to the percentage of homes receiving Food Stamps?
Cities must have a minimum of 1,000 residents to qualify
| City | Food Stamps | Details |
|---|---|---|
Arlington |
2.0% |
142 of 7,173 Arlington households received food stamps within the past year. |
Arlington Heights |
0.0% |
0 of 947 Arlington Heights households received food stamps within the past year. |
Alderwood Manor |
2.2% |
71 of 3,159 Alderwood Manor households received food stamps within the past year. |
Bothell East |
2.1% |
75 of 3,599 Bothell East households received food stamps within the past year. |
Bothell West |
0.8% |
55 of 7,199 Bothell West households received food stamps within the past year. |
Brier |
3.3% |
81 of 2,484 Brier households received food stamps within the past year. |
Bryant |
0.0% |
0 of 655 Bryant households received food stamps within the past year. |
Bunk Foss |
0.0% |
0 of 1,216 Bunk Foss households received food stamps within the past year. |
Canyon Creek |
0.6% |
7 of 1,144 Canyon Creek households received food stamps within the past year. |
Cathcart |
0.0% |
0 of 969 Cathcart households received food stamps within the past year. |
Cavalero |
0.0% |
0 of 1,709 Cavalero households received food stamps within the past year. |
Chain Lake |
1.4% |
20 of 1,395 Chain Lake households received food stamps within the past year. |
Clearview |
1.8% |
24 of 1,335 Clearview households received food stamps within the past year. |
Darrington |
2.9% |
17 of 581 Darrington households received food stamps within the past year. |
Eastmont |
1.3% |
95 of 7,300 Eastmont households received food stamps within the past year. |
Edmonds |
1.3% |
222 of 17,515 Edmonds households received food stamps within the past year. |
Esperance |
3.7% |
56 of 1,503 Esperance households received food stamps within the past year. |
Everett |
1.0% |
437 of 42,652 Everett households received food stamps within the past year. |
Fobes Hill |
1.4% |
15 of 1,046 Fobes Hill households received food stamps within the past year. |
Gold Bar |
2.2% |
17 of 769 Gold Bar households received food stamps within the past year. |
Granite Falls |
4.2% |
65 of 1,546 Granite Falls households received food stamps within the past year. |
High Bridge |
2.1% |
23 of 1,096 High Bridge households received food stamps within the past year. |
Lake Cassidy |
0.9% |
11 of 1,201 Lake Cassidy households received food stamps within the past year. |
Lake Stevens |
1.2% |
129 of 10,582 Lake Stevens households received food stamps within the past year. |
Lake Stickney |
2.5% |
80 of 3,258 Lake Stickney households received food stamps within the past year. |
Larch Way |
0.0% |
0 of 1,400 Larch Way households received food stamps within the past year. |
Lochsloy |
1.5% |
16 of 1,091 Lochsloy households received food stamps within the past year. |
Lynnwood |
2.2% |
307 of 14,088 Lynnwood households received food stamps within the past year. |
Maltby |
1.1% |
45 of 4,037 Maltby households received food stamps within the past year. |
Martha Lake |
1.2% |
76 of 6,510 Martha Lake households received food stamps within the past year. |
Marysville |
1.8% |
435 of 23,824 Marysville households received food stamps within the past year. |
Meadowdale |
1.7% |
17 of 1,020 Meadowdale households received food stamps within the past year. |
Mill Creek |
0.5% |
41 of 7,799 Mill Creek households received food stamps within the past year. |
Mill Creek East |
1.3% |
85 of 6,744 Mill Creek East households received food stamps within the past year. |
Monroe |
1.3% |
72 of 5,358 Monroe households received food stamps within the past year. |
Monroe North |
0.0% |
0 of 567 Monroe North households received food stamps within the past year. |
Mountlake Terrace |
1.3% |
109 of 8,216 Mountlake Terrace households received food stamps within the past year. |
Mukilteo |
1.0% |
84 of 8,177 Mukilteo households received food stamps within the past year. |
North Lynnwood |
2.7% |
211 of 7,854 North Lynnwood households received food stamps within the past year. |
Picnic Point |
2.0% |
66 of 3,380 Picnic Point households received food stamps within the past year. |
Silver Firs |
1.6% |
117 of 7,164 Silver Firs households received food stamps within the past year. |
Sisco Heights |
2.4% |
24 of 988 Sisco Heights households received food stamps within the past year. |
Snohomish |
1.1% |
42 of 3,744 Snohomish households received food stamps within the past year. |
Stanwood |
0.7% |
17 of 2,423 Stanwood households received food stamps within the past year. |
Sultan |
1.8% |
35 of 1,911 Sultan households received food stamps within the past year. |
Swede Heaven |
0.0% |
0 of 456 Swede Heaven households received food stamps within the past year. |
Three Lakes |
2.4% |
28 of 1,176 Three Lakes households received food stamps within the past year. |
Warm Beach |
3.1% |
30 of 962 Warm Beach households received food stamps within the past year. |
Woods Creek |
1.0% |
19 of 1,947 Woods Creek households received food stamps within the past year. |
Woodway |
2.2% |
10 of 456 Woodway households received food stamps within the past year. |