1.3% of Households Receive Food Stamps in Tacoma, Washington
Food Stamps in Tacoma, Washington
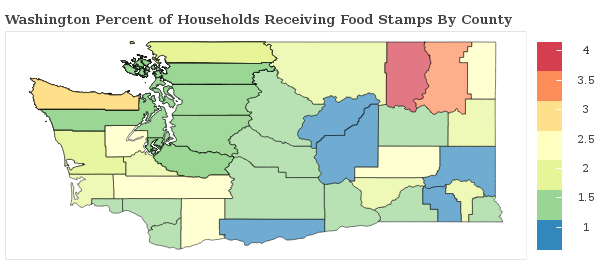
What percent of Households Receive Food Stamps in Tacoma?
The percentage of households receiving food stamps in the last year in Tacoma is 1.3%.
How Many Households in Tacoma Receive Food Stamps?
There are 1073 households out of 82016 in Tacoma receiving food stamps.
Where does Tacoma Rank in Comparison to Other Washington Cities for HouseHolds Receiving Food Stamps?
Tacoma ranks 201st out of 383 cities and towns in Washington for the least number of households receiving food stamps. A smaller numeric rank indicates a lower percentage of homes receive food stamps.
How do other cities in Pierce County compare to Tacoma when it comes to the percentage of homes receiving Food Stamps?
Cities must have a minimum of 1,000 residents to qualify
| City | Food Stamps | Details |
|---|---|---|
Anderson Island |
0.0% |
0 of 670 Anderson Island households received food stamps within the past year. |
Artondale |
2.4% |
112 of 4,600 Artondale households received food stamps within the past year. |
Alderton |
0.7% |
9 of 1,231 Alderton households received food stamps within the past year. |
Bonney Lake |
0.6% |
37 of 6,529 Bonney Lake households received food stamps within the past year. |
Buckley |
0.0% |
0 of 1,802 Buckley households received food stamps within the past year. |
Canterwood |
0.9% |
12 of 1,290 Canterwood households received food stamps within the past year. |
Clover Creek |
0.3% |
8 of 2,554 Clover Creek households received food stamps within the past year. |
Crocker |
6.3% |
27 of 429 Crocker households received food stamps within the past year. |
Dash Point |
0.0% |
0 of 384 Dash Point households received food stamps within the past year. |
DuPont |
1.3% |
45 of 3,376 DuPont households received food stamps within the past year. |
Eatonville |
0.6% |
7 of 1,139 Eatonville households received food stamps within the past year. |
Edgewood |
1.7% |
64 of 3,694 Edgewood households received food stamps within the past year. |
Elk Plain |
2.0% |
96 of 4,905 Elk Plain households received food stamps within the past year. |
Fife |
1.0% |
38 of 3,628 Fife households received food stamps within the past year. |
Fife Heights |
0.9% |
6 of 657 Fife Heights households received food stamps within the past year. |
Fircrest |
1.7% |
48 of 2,748 Fircrest households received food stamps within the past year. |
Fort Lewis |
1.5% |
50 of 3,399 Fort Lewis households received food stamps within the past year. |
Fox Island |
1.3% |
18 of 1,426 Fox Island households received food stamps within the past year. |
Frederickson |
1.2% |
80 of 6,946 Frederickson households received food stamps within the past year. |
Gig Harbor |
1.2% |
44 of 3,690 Gig Harbor households received food stamps within the past year. |
Graham |
1.4% |
117 of 8,602 Graham households received food stamps within the past year. |
Home |
4.2% |
26 of 613 Home households received food stamps within the past year. |
Key Center |
4.0% |
56 of 1,407 Key Center households received food stamps within the past year. |
Lake Tapps |
2.6% |
115 of 4,478 Lake Tapps households received food stamps within the past year. |
Lakewood |
1.5% |
353 of 24,129 Lakewood households received food stamps within the past year. |
Longbranch |
1.2% |
16 of 1,346 Longbranch households received food stamps within the past year. |
McChord AFB |
0.6% |
5 of 775 McChord AFB households received food stamps within the past year. |
McMillin |
1.8% |
11 of 627 McMillin households received food stamps within the past year. |
Maplewood |
1.8% |
38 of 2,075 Maplewood households received food stamps within the past year. |
Midland |
1.7% |
55 of 3,269 Midland households received food stamps within the past year. |
North Fort Lewis |
0.4% |
3 of 791 North Fort Lewis households received food stamps within the past year. |
North Puyallup |
2.1% |
18 of 844 North Puyallup households received food stamps within the past year. |
Orting |
2.2% |
54 of 2,460 Orting households received food stamps within the past year. |
Parkland |
2.4% |
314 of 13,173 Parkland households received food stamps within the past year. |
Prairie Heights |
0.7% |
9 of 1,379 Prairie Heights households received food stamps within the past year. |
Prairie Ridge |
1.5% |
62 of 4,200 Prairie Ridge households received food stamps within the past year. |
Purdy |
0.0% |
0 of 538 Purdy households received food stamps within the past year. |
Puyallup |
2.1% |
331 of 15,541 Puyallup households received food stamps within the past year. |
Rosedale |
5.0% |
61 of 1,208 Rosedale households received food stamps within the past year. |
Ruston |
1.3% |
6 of 458 Ruston households received food stamps within the past year. |
South Creek |
3.1% |
33 of 1,074 South Creek households received food stamps within the past year. |
South Hill |
1.5% |
292 of 18,935 South Hill households received food stamps within the past year. |
Spanaway |
1.3% |
132 of 10,444 Spanaway households received food stamps within the past year. |
Stansberry Lake |
1.4% |
12 of 834 Stansberry Lake households received food stamps within the past year. |
Steilacoom |
2.3% |
58 of 2,527 Steilacoom households received food stamps within the past year. |
Summit |
0.9% |
27 of 3,006 Summit households received food stamps within the past year. |
Summit View |
1.1% |
32 of 2,878 Summit View households received food stamps within the past year. |
Sumner |
2.3% |
94 of 4,010 Sumner households received food stamps within the past year. |
Tacoma |
1.3% |
1073 of 82,016 Tacoma households received food stamps within the past year. |
University Place |
1.3% |
169 of 12,888 University Place households received food stamps within the past year. |
Waller |
0.7% |
22 of 3,147 Waller households received food stamps within the past year. |
Wauna |
0.5% |
8 of 1,603 Wauna households received food stamps within the past year. |
Wollochet |
1.0% |
25 of 2,587 Wollochet households received food stamps within the past year. |