1.2% of Households Receive Food Stamps in Hoover, Alabama
Food Stamps in Hoover, Alabama
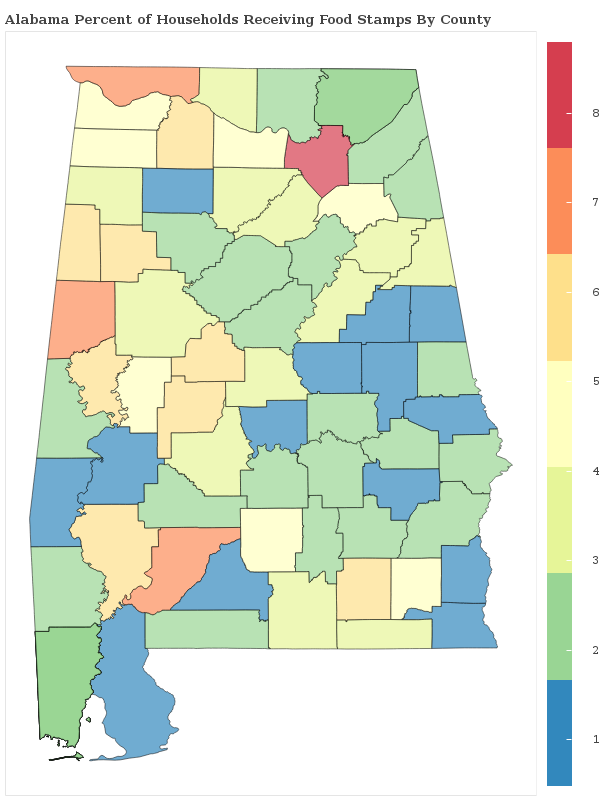
What percent of Households Receive Food Stamps in Hoover?
The percentage of households receiving food stamps in the last year in Hoover is 1.2%.
How Many Households in Hoover Receive Food Stamps?
There are 385 households out of 32936 in Hoover receiving food stamps.
Where does Hoover Rank in Comparison to Other Alabama Cities for HouseHolds Receiving Food Stamps?
Hoover ranks 84th out of 316 cities and towns in Alabama for the least number of households receiving food stamps. A smaller numeric rank indicates a lower percentage of homes receive food stamps.
Here is a comparison of Food Stamps by city(minimum 1,000 residents) in Jefferson County, Shelby County.
| City | Food Stamps | Details |
|---|---|---|
Adamsville |
2.6% |
41 of 1,601 Adamsville households received food stamps within the past year. |
Bessemer |
3.1% |
325 of 10,469 Bessemer households received food stamps within the past year. |
Brighton |
1.1% |
12 of 1,090 Brighton households received food stamps within the past year. |
Brookside |
0.6% |
3 of 499 Brookside households received food stamps within the past year. |
Center Point |
2.2% |
137 of 6,170 Center Point households received food stamps within the past year. |
Clay |
1.8% |
64 of 3,483 Clay households received food stamps within the past year. |
Concord |
0.0% |
0 of 705 Concord households received food stamps within the past year. |
Fairfield |
0.6% |
29 of 4,485 Fairfield households received food stamps within the past year. |
Forestdale |
2.4% |
92 of 3,886 Forestdale households received food stamps within the past year. |
Fultondale |
0.8% |
31 of 3,871 Fultondale households received food stamps within the past year. |
Gardendale |
0.3% |
17 of 5,505 Gardendale households received food stamps within the past year. |
Grayson Valley |
0.8% |
19 of 2,479 Grayson Valley households received food stamps within the past year. |
Graysville |
4.2% |
33 of 777 Graysville households received food stamps within the past year. |
Homewood |
1.1% |
112 of 9,957 Homewood households received food stamps within the past year. |
Hueytown |
0.9% |
52 of 5,885 Hueytown households received food stamps within the past year. |
Irondale |
0.3% |
16 of 4,983 Irondale households received food stamps within the past year. |
Kimberly |
1.8% |
17 of 969 Kimberly households received food stamps within the past year. |
Lipscomb |
2.6% |
20 of 770 Lipscomb households received food stamps within the past year. |
Midfield |
1.3% |
24 of 1,800 Midfield households received food stamps within the past year. |
Minor |
0.0% |
0 of 387 Minor households received food stamps within the past year. |
Morris |
0.4% |
3 of 737 Morris households received food stamps within the past year. |
Mountain Brook |
1.1% |
80 of 7,462 Mountain Brook households received food stamps within the past year. |
Mount Olive |
1.2% |
17 of 1,435 Mount Olive households received food stamps within the past year. |
Pinson |
0.8% |
23 of 2,940 Pinson households received food stamps within the past year. |
Pleasant Grove |
0.9% |
34 of 3,688 Pleasant Grove households received food stamps within the past year. |
Rock Creek |
0.9% |
5 of 537 Rock Creek households received food stamps within the past year. |
Sylvan Springs |
2.2% |
14 of 632 Sylvan Springs households received food stamps within the past year. |
Tarrant |
2.5% |
57 of 2,256 Tarrant households received food stamps within the past year. |
Warrior |
2.2% |
33 of 1,522 Warrior households received food stamps within the past year. |