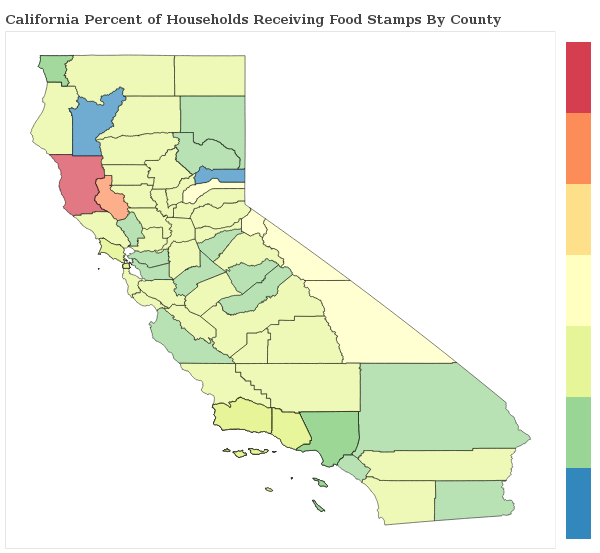
1.5% of Households Receive Food Stamps in Fresno, California
Food Stamps in Fresno, California
What percent of Households Receive Food Stamps in Fresno?
The percentage of households receiving food stamps in the last year in Fresno is 1.5%.
How Many Households in Fresno Receive Food Stamps?
There are 2464 households out of 165107 in Fresno receiving food stamps.
Where does Fresno Rank in Comparison to Other California Cities for HouseHolds Receiving Food Stamps?
Fresno ranks 596th out of 1018 cities and towns in California for the least number of households receiving food stamps. A smaller numeric rank indicates a lower percentage of homes receive food stamps.
How do other cities in Fresno County compare to Fresno when it comes to the percentage of homes receiving Food Stamps?
Cities must have a minimum of 1,000 residents to qualify
| City | Food Stamps | Details |
|---|---|---|
Caruthers |
1.0% |
8 of 792 Caruthers households received food stamps within the past year. |
Clovis |
1.6% |
558 of 35,538 Clovis households received food stamps within the past year. |
Coalinga |
2.7% |
115 of 4,302 Coalinga households received food stamps within the past year. |
Del Rey |
0.0% |
0 of 394 Del Rey households received food stamps within the past year. |
Easton |
2.8% |
16 of 568 Easton households received food stamps within the past year. |
Fresno |
1.5% |
2464 of 165,107 Fresno households received food stamps within the past year. |
Auberry |
0.0% |
0 of 933 Auberry households received food stamps within the past year. |
Biola |
0.0% |
0 of 329 Biola households received food stamps within the past year. |
Firebaugh |
0.0% |
0 of 2,203 Firebaugh households received food stamps within the past year. |
Fowler |
0.7% |
12 of 1,828 Fowler households received food stamps within the past year. |
Huron |
4.3% |
76 of 1,751 Huron households received food stamps within the past year. |
Kerman |
1.7% |
64 of 3,802 Kerman households received food stamps within the past year. |
Kingsburg |
1.3% |
51 of 3,865 Kingsburg households received food stamps within the past year. |
Laton |
6.1% |
36 of 595 Laton households received food stamps within the past year. |
Malaga |
10.0% |
27 of 271 Malaga households received food stamps within the past year. |
Mayfair |
0.0% |
0 of 1,433 Mayfair households received food stamps within the past year. |
Mendota |
1.1% |
29 of 2,738 Mendota households received food stamps within the past year. |
Minkler |
14.6% |
77 of 526 Minkler households received food stamps within the past year. |
Old Fig Garden |
1.0% |
22 of 2,259 Old Fig Garden households received food stamps within the past year. |
Orange Cove |
0.7% |
17 of 2,342 Orange Cove households received food stamps within the past year. |
Parlier |
0.2% |
6 of 3,765 Parlier households received food stamps within the past year. |
Reedley |
1.5% |
111 of 7,351 Reedley households received food stamps within the past year. |
Riverdale |
4.9% |
48 of 976 Riverdale households received food stamps within the past year. |
Sanger |
1.0% |
72 of 6,957 Sanger households received food stamps within the past year. |
San Joaquin |
4.2% |
43 of 1,035 San Joaquin households received food stamps within the past year. |
Selma |
1.5% |
102 of 6,725 Selma households received food stamps within the past year. |
Squaw Valley |
0.0% |
0 of 1,047 Squaw Valley households received food stamps within the past year. |
Sunnyside |
0.8% |
12 of 1,582 Sunnyside households received food stamps within the past year. |
Tarpey Village |
1.4% |
16 of 1,173 Tarpey Village households received food stamps within the past year. |
