0.9% of Households Receive Food Stamps in Killeen, Texas
Food Stamps in Killeen, Texas
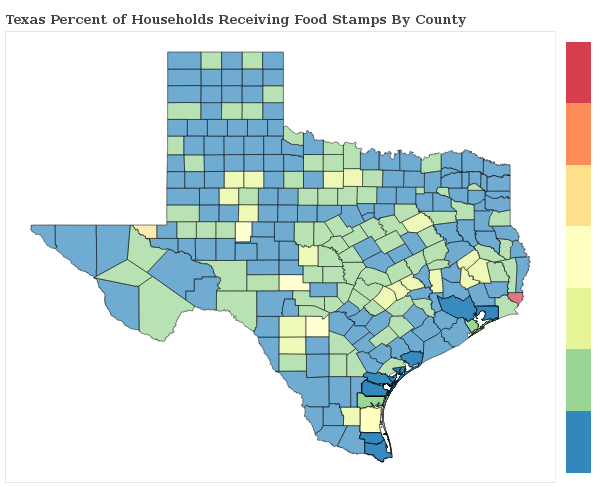
What percent of Households Receive Food Stamps in Killeen?
The percentage of households receiving food stamps in the last year in Killeen is 0.9%.
How Many Households in Killeen Receive Food Stamps?
There are 458 households out of 50089 in Killeen receiving food stamps.
Where does Killeen Rank in Comparison to Other Texas Cities for HouseHolds Receiving Food Stamps?
Killeen ranks 409th out of 983 cities and towns in Texas for the least number of households receiving food stamps. A smaller numeric rank indicates a lower percentage of homes receive food stamps.
How do other cities in Bell County compare to Killeen when it comes to the percentage of homes receiving Food Stamps?
Cities must have a minimum of 1,000 residents to qualify
| City | Food Stamps | Details |
|---|---|---|
Belton |
0.7% |
48 of 6,909 Belton households received food stamps within the past year. |
Harker Heights |
1.4% |
138 of 9,923 Harker Heights households received food stamps within the past year. |
Holland |
2.3% |
9 of 391 Holland households received food stamps within the past year. |
Killeen |
0.9% |
458 of 50,089 Killeen households received food stamps within the past year. |
Little River-Academy |
0.9% |
6 of 664 Little River-Academy households received food stamps within the past year. |
Morgan's Point Resort |
3.1% |
49 of 1,583 Morgan's Point Resort households received food stamps within the past year. |
Nolanville |
1.7% |
28 of 1,630 Nolanville households received food stamps within the past year. |
Rogers |
0.0% |
0 of 387 Rogers households received food stamps within the past year. |
Salado |
0.0% |
0 of 958 Salado households received food stamps within the past year. |
Temple |
0.9% |
243 of 26,127 Temple households received food stamps within the past year. |
Troy |
0.0% |
0 of 653 Troy households received food stamps within the past year. |