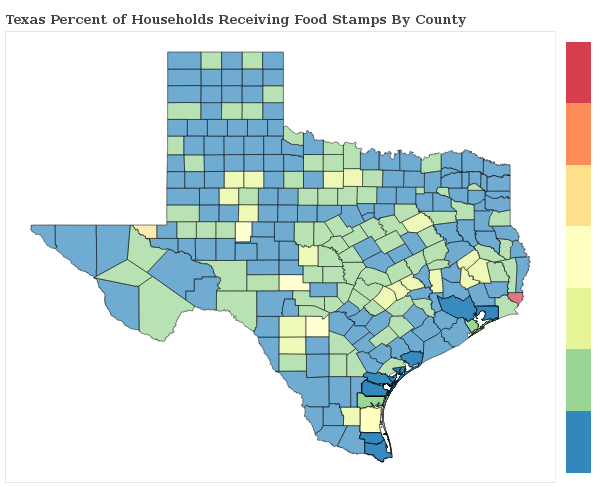
1.0% of Households Receive Food Stamps in McKinney, Texas
Food Stamps in McKinney, Texas
What percent of Households Receive Food Stamps in McKinney?
The percentage of households receiving food stamps in the last year in McKinney is 1.0%.
How Many Households in McKinney Receive Food Stamps?
There are 574 households out of 56408 in McKinney receiving food stamps.
Where does McKinney Rank in Comparison to Other Texas Cities for HouseHolds Receiving Food Stamps?
McKinney ranks 459th out of 983 cities and towns in Texas for the least number of households receiving food stamps. A smaller numeric rank indicates a lower percentage of homes receive food stamps.
How do other cities in Collin County compare to McKinney when it comes to the percentage of homes receiving Food Stamps?
Cities must have a minimum of 1,000 residents to qualify
| City | Food Stamps | Details |
|---|---|---|
Allen |
1.4% |
436 of 31,569 Allen households received food stamps within the past year. |
Anna |
2.9% |
95 of 3,271 Anna households received food stamps within the past year. |
Blue Ridge |
1.8% |
6 of 333 Blue Ridge households received food stamps within the past year. |
Fairview |
2.4% |
81 of 3,414 Fairview households received food stamps within the past year. |
Farmersville |
1.6% |
23 of 1,434 Farmersville households received food stamps within the past year. |
Lavon |
1.7% |
15 of 870 Lavon households received food stamps within the past year. |
Lowry Crossing |
0.7% |
4 of 595 Lowry Crossing households received food stamps within the past year. |
Lucas |
4.1% |
77 of 1,889 Lucas households received food stamps within the past year. |
McKinney |
1.0% |
574 of 56,408 McKinney households received food stamps within the past year. |
Melissa |
0.0% |
0 of 2,231 Melissa households received food stamps within the past year. |
Murphy |
1.4% |
75 of 5,392 Murphy households received food stamps within the past year. |
Nevada |
2.5% |
8 of 325 Nevada households received food stamps within the past year. |
Parker |
0.8% |
10 of 1,220 Parker households received food stamps within the past year. |
Princeton |
1.2% |
36 of 3,116 Princeton households received food stamps within the past year. |
St. Paul |
2.7% |
9 of 329 St. Paul households received food stamps within the past year. |
